- The Science Content Lab
- Posts
- Metrics That Matter for Deep Tech Marketing
Metrics That Matter for Deep Tech Marketing
Suchitha Champak
July 07, 2025

TL;DR: Metrics That Matter in Deep Tech Marketing
Traditional marketing metrics fall short in biotech, medtech, and healthtech—where clarity, trust, and expert engagement are the real success signals. This issue unpacks how to go beyond clicks to measure content quality and stakeholder resonance.
Key Takeaways:
Clarity converts: Scroll depth and content flow > flashy design.
Smarter KPIs: Track demo bookings, saves, and expert shares—not just views.
Case-driven insights: From precision ABM to HIPAA-aligned trust metrics.
Practical toolkit: Use tools like Hotjar, Clearbit, and Fathom to track real engagement.
SciRio behind the scenes: LinkedIn analytics can reveal what resonates with scientists and investors.
Notion bonus: Build your own dashboard to score clarity, trust, and resonance per persona.
Skip the vanity metrics. Measure what actually drives trust, clarity, and impact in deep tech communication.
Welcome, reader!
In deep tech—spanning biotech, medtech, and healthcare—it’s not enough for content to be seen; it must be understood, trusted, and acted upon. Traditional metrics like impressions and click through rate (CTR) don’t reveal whether domain experts or decision‑makers truly grasp and trust your message. This issue shows how to measure real content impact—clarity, resonance, and stakeholder trust—and back it with real-world cases.
Featured Insight: Clarity Converts
Research from Content Science Review shows that high-performing B2B science content stood out not by flashy design, but by crystal-clear organization—measured through scroll depth and reader progression.
In practice, companies like Benchling simplify complex biotech workflows into modular content, making deep research topics more digestible—and boosting content adoption and clarity.

Innovation Showcase: KPIs from Real-World Examples
Data-Driven Mergers & Acquisitions (M&A) in Home Care
A leading medtech company’s entry into the U.S. home care market shows how data-driven metrics can power deep tech growth. By partnering with S2N Health and using the RepSignal platform, the company analyzed physician adoption rates, technology usage, and competitor activity—all key metrics for market entry.
Combining these insights with interviews from industry stakeholders, the company quickly identified high-value acquisition targets and mapped out a strategic, low-risk M&A plan. This case underscores how the right metrics enable smarter, faster decisions in deep tech marketing and expansion.
Precision Account-based marketing (ABM) Fuels Growth
League, a healthcare experience platform, leveraged Demandbase’s account-based marketing (ABM) solution to overcome pipeline challenges. By focusing on targeted advertising and data-driven insights, they boosted meeting bookings by 41% among engaged accounts.
Key success factors included:
Precision targeting of high-value accounts
Strong sales-marketing alignment
Real-time campaign optimization through actionable metrics
This case shows how tracking meeting bookings and account engagement can drive measurable growth in deep tech marketing.
Compliance as a Growth Driver
In healthcare, compliance metrics are vital for trust and growth. With data breaches costing millions, early Health Insurance Portability and Accountability Act (HIPAA) alignment and adoption of frameworks like International Organization for Standardization (ISO) 27001, Service Organization Control 2 (SOC 2), and Health Information Trust Alliance (HITRUST) are essential.
Key focus areas include:
Ensuring HIPAA compliance for products handling Protected Health Information (PHI)
Implementing artificial intelligence (AI) governance with the National Institute of Standards and Technology (NIST) AI Risk Management Framework (AI RMF)
Automating continuous monitoring for General Data Protection Regulation (GDPR) and SOC 2
Tracking these metrics helps avoid risks, speed sales cycles, and differentiate your deep tech solution in a competitive market.

Practical Tools for Tracking Beyond Clicks
Tool | Function | Visual Tip |
|---|---|---|
Capture scroll and click heatmaps, session recordings, and user journey analytics to visualize how visitors interact with your site. | Use heatmaps to highlight unclear or ignored sections and optimize user experience. | |
Identify companies visiting your site and attribute engagement to firmographic data, enabling you to track re-visits by target organizations. | Monitor which high-value accounts are returning and engaging with your key content. | |
Provide privacy-first engagement analytics, including time-on-page and event tracking, to measure user interaction without compromising privacy. | Map time-on-page against calls-to-action (CTAs) to pinpoint what drives deeper engagement. | |
Offer account intelligence, intent insights, and audience research to help prioritize prospects and score content resonance by persona. | Score and compare how different personas engage with your content and campaigns. |
These tools empower deep tech marketers to move beyond basic clicks, delivering actionable insights into user behavior, account-level engagement, and content effectiveness.

From the Field: Real-World Benchmarks
McKinsey: Medtech CX Metrics
According to McKinsey, leading medtech companies are evolving their customer experience (CX) strategies by tracking transactional satisfaction and building NPS driver trees—structured models that break down Net Promoter Score into actionable components like product clarity, service responsiveness, and onboarding effectiveness. These insights help companies design targeted onboarding materials that address specific friction points in the customer journey.
Source: McKinsey – Delivering a stellar experience for all key stakeholders in medtech
ICOVY: Funnel Optimization
ICOVY Health Marketing, a medtech-focused agency, emphasizes lead quality, traffic depth, and speed to contract per persona as core KPIs in funnel optimization. Their approach prioritizes persona-specific content and conversion-focused design, helping clients close deals faster than traditional awareness-based campaigns. Source: ICOVY Health Marketing

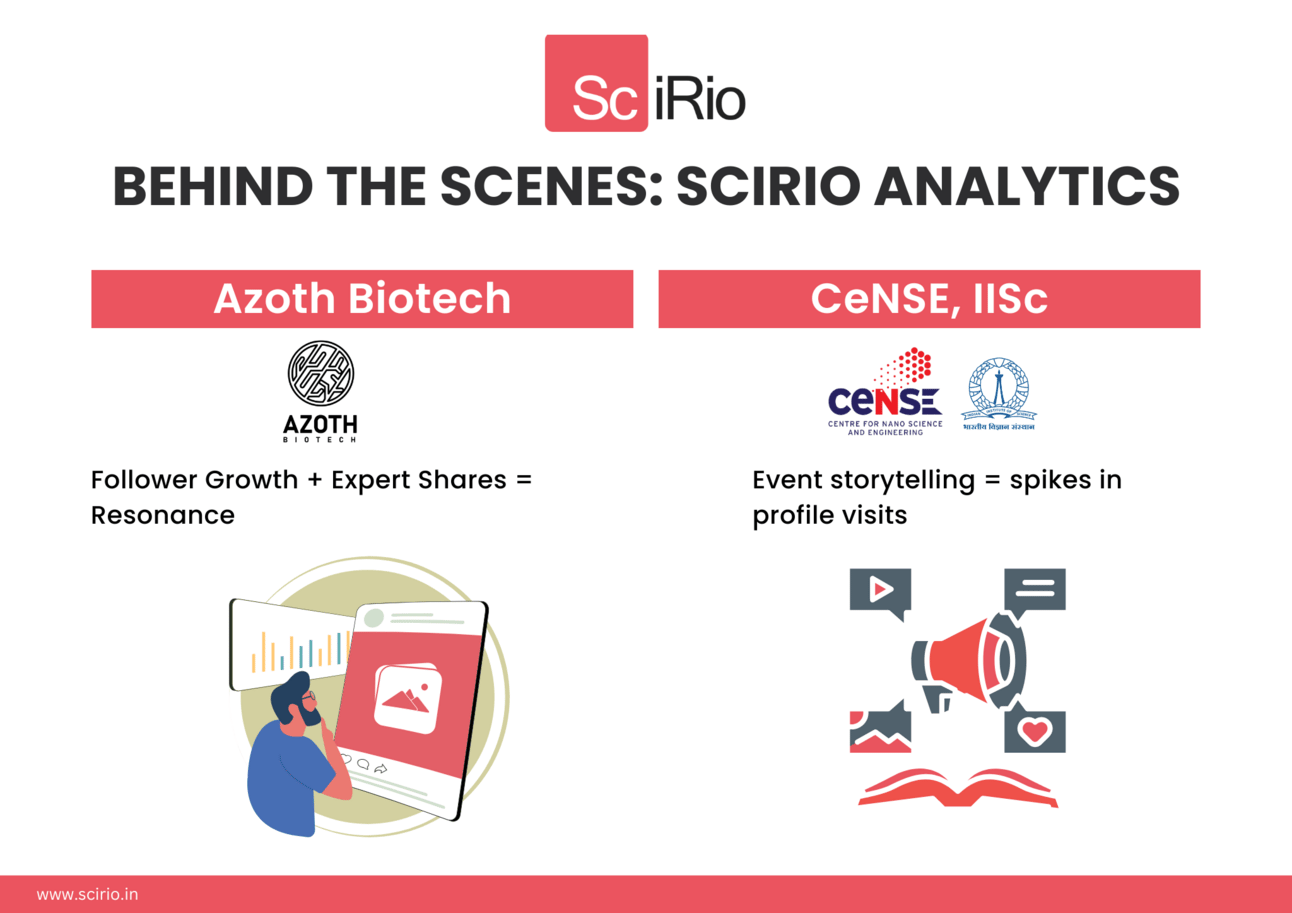
Behind the Scenes: SciRio's Use of LinkedIn Analytics
At SciRio, we’ve helped teams like Azoth Biotech and CeNSE, IISc use LinkedIn analytics toward insights that guide better content.
For Azoth Biotech, the goal was to see what resonated with scientists and investors. Instead of just tracking views, we focused on:
How often posts led to new followers
Whether domain experts shared the content
With CeNSE, our strategy combined research-based storytelling with live social coverage of events like the Nanoelectronics Roadshow 2025. Together, these efforts drove:
Real-time engagement from both academic and industry audiences
A measurable increase in profile visits and content shares during key campaigns
Content sequencing insights—posts with contextual intros and visuals consistently attracted higher engagement from new and returning followers
What we learned: Even simple LinkedIn analytics—when tracked by audience type and content format—can uncover what kinds of science stories are being read, trusted, and acted on.
B2B vs B2C Metrics: Same Tools, Very Different Signals
While biotech, medtech, and healthtech brands often use the same platforms and tools as mainstream marketers, their goals—and what counts as meaningful engagement—are entirely different. Here’s how:
Metric | B2C Focus (Pharma, Wellness, D2C) | B2B Focus (Biotech, Medtech, Healthtech) |
|---|---|---|
Impressions / Reach | Measures broad brand awareness | Less useful unless paired with target audience match |
Likes / Shares | Drives virality and brand visibility | Only meaningful if coming from credible peers or decision-makers |
Follower Growth | Tracks general popularity trends | Needs segmentation—who's following matters more than how many |
Clickthrough Rate (CTR) | Signals surface-level interest | Combine with scroll depth or follow-up action for real signal |
Saves / Bookmarks | Often overlooked | High-value indicator of content clarity and trust |
Engaged Time / Scroll | Rarely tracked | Key clarity metric—did they actually read and understand? |
Demo Requests / DMs | Uncommon in B2C funnel | Strong signal of readiness and content alignment |
Shares by Role / Org | Not usually differentiated | Crucial—expert reshares validate authority |
Bottom line: In deep tech, who engages and how matters far more than how many. Clear content that earns trust from scientists, clinicians, or investors is more powerful than reach alone.

Community Corner
Your Turn: What is the most revealing KPI you've used to prove content clarity or stakeholder trust in deep tech? Share via email or tag us in your social media posts—we'll spotlight top insights next issue!
Missed our last issue? Read it here.
Subscriber Bonus
Free Resource: “Metrics That Matter” Notion Template Flowchart
Score content clarity, stakeholder trust, and resonance with customizable calculations aligned to biotech, medtech, and healthcare funnel stages.
How to Use the “Metrics That Matter” Flowchart to Build Your Notion Template
You’ve seen the infographic—now here’s how to turn it into a fully functional content tracking system in Notion. This step-by-step guide walks you through each block in the flowchart so you can create a living dashboard that scores clarity, trust, and resonance across your content lifecycle.
1️⃣ Dashboard Overview
What to build: A high-level Notion board or gallery view
Purpose: Visualize how your content performs across the funnel:
Awareness
Education
Decision
How to set it up:
Create a new Notion page called “Metrics Dashboard”
Use a Board View with columns for each funnel stage
Each card = one content asset, linked to detailed metrics (from Step 2)
Why it matters: Gives leadership or team members a snapshot of performance per stage, not just total views.
2️⃣ Content Asset Tracker
What to build: A Notion Table Database
Purpose: Store and score every piece of content—by audience, format, and outcome
Key columns to include:
Content Title
Type (e.g. Post, Thread, Deck)
Target Persona (dropdown: Researcher, Clinician, C-suite, etc.)
Funnel Stage (Awareness, Education, Decision)
Publish Date
Clarity Score (formula)
Trust Score (formula)
Resonance Score (formula)
Performance Notes
Pro tip: Use Notion formulas to automate scoring: e.g., scroll depth × read time for clarity.
3️⃣ Metric Definitions
What to build: A separate “Glossary + Formula” page in Notion
Purpose: Explain how each score is calculated, and what “good” looks like
What to include:
Clarity Score → scroll % × read time (e.g., 0.6 × 180 sec = 108 clarity units)
Trust Index → (Saves + Expert Shares) ÷ Views
Resonance Score → (Demo Bookings + DMs + Return Visits) ÷ Views
Benchmarks:
Clarity: >50% scroll depth
Trust: >1% of viewers save or share
Resonance: >0.5% act on it (e.g., book demo)
Why it matters: Aligns your team on what success looks like—no more vague metrics.
4️⃣ Engagement Log
What to build: A Notion Calendar or Table View
Purpose: Track live campaign performance—especially for events, launches, or roadshows
Fields to include:
Date
Campaign/Event Name
Platform
Real-time Metrics (likes, comments, saves, shares)
Notes or Screenshots
Post-Campaign Outcomes (profile visits, DMs, referrals)
Use Case: For CeNSE IISc, we used this to log daily performance during the Nanoelectronics Roadshow.
5️⃣ Persona Tracker
What to build: A table with grouped views by Persona
Purpose: Understand how different stakeholders engage with your content
Columns to include:
Persona (Researcher, Clinician, etc.)
Total Views
Average Clarity Score
Average Trust Index
Conversion Actions (DMs, Follows, Shares)
Recommended Content Types
Why it matters: You’re not guessing who your content is for—you’re tailoring it to what your real audience responds to.
✅ Final Step: Turn It Into a System
Once you’ve set this up:
Link each asset entry to the dashboard
Schedule monthly reviews
Track trends over time (e.g., which formats have the highest trust among investors?)
Want It Prebuilt?
Reply to this email with “Send the Notion Template” or tag us @SciRio—we’ll send you the ready-to-duplicate version.

Final Word
Clicks are visibility. Engagement is interest. But in deep tech, true metrics are trust, clarity, and conversion. Track scrolls, repeat visits, qualified meetings, and persona-specific satisfaction and prize clarity as the new conversion rate.
Have you read our latest article yet?
 | Have you wondered if you could pursue a side-quest in science communication as a full-time PhD scholar? In our latest blog, Arushi Batra describes her journey as a Indian PhD scholar who pulled a scicomm career dream through strategic juggling and leaping at scicomm whenever opportunity arose. |